Photo by LendingMemo 
Fidelity, Schwab, T Rowe Price, and Vanguard each offer index funds that cover the entire domestic and international stock markets and the domestic bond market. But which company’s index funds should you choose? Are they all the same?
I look for index funds with the lowest expenses. Expenses over the long-term reduce the fund’s return. So seek the fund with the cheapest expense ratio.
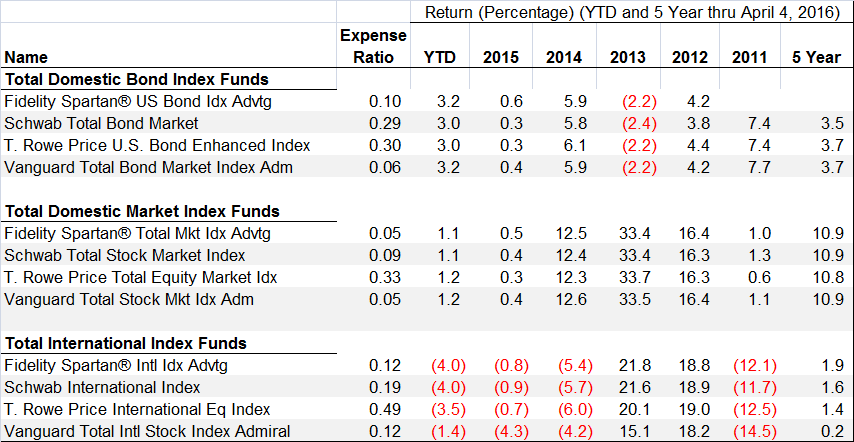
The chart below shows the index fund offerings from Fidelity, Schwab, T Rowe Price, and Vanguard. The expense ratio is listed along with the annual average returns for each fund. The expense ratio is already reflected in the annual return.
There is no real difference among the company’s offerings of total domestic bond funds or total domestic stock funds. The T Rowe Price Total Equity Index Fund has a slightly higher expense ratio and a slightly lower return (0.1%) than the other company’s domestic stock market offerings.
The real difference is in the international stock offerings. Again the T Rowe Price fund has the higher expense ratio and the lowest five-year average return. But the big difference is that Vanguard’s international index fund has a lower expense ratio and a lower five-year return. The main reason is that is contains a greater share of emerging market companies. They have not done as well compared to developed international markets.
My takeaway from the chart is that the Fidelity index funds as a group are superior (albeit ever so slightly) than the offerings from Schwab, T Rowe Price, and Vanguard.
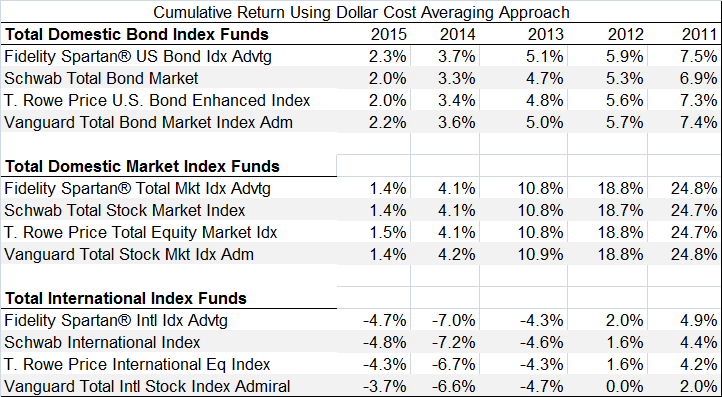
Fidelity’s superior performance holds when you look at each of these funds using a dollar cost averaging approach to calculating return. This approach assumed that in each year in the chart, the same amount was invested in each fund on the first day of each month. For example, if you invested $200/month since January 2011 on the first of each month in the Fidelity Spartan US Bond Index Fund, your total return would be 7.5% (see the 2011 column).
In sum Fidelity’s index funds have the lowest expenses and best track record from 2011 through the first quarter of 2016.


No comments yet.